









Calculating ROI for Educational Technology by Cost Per Student
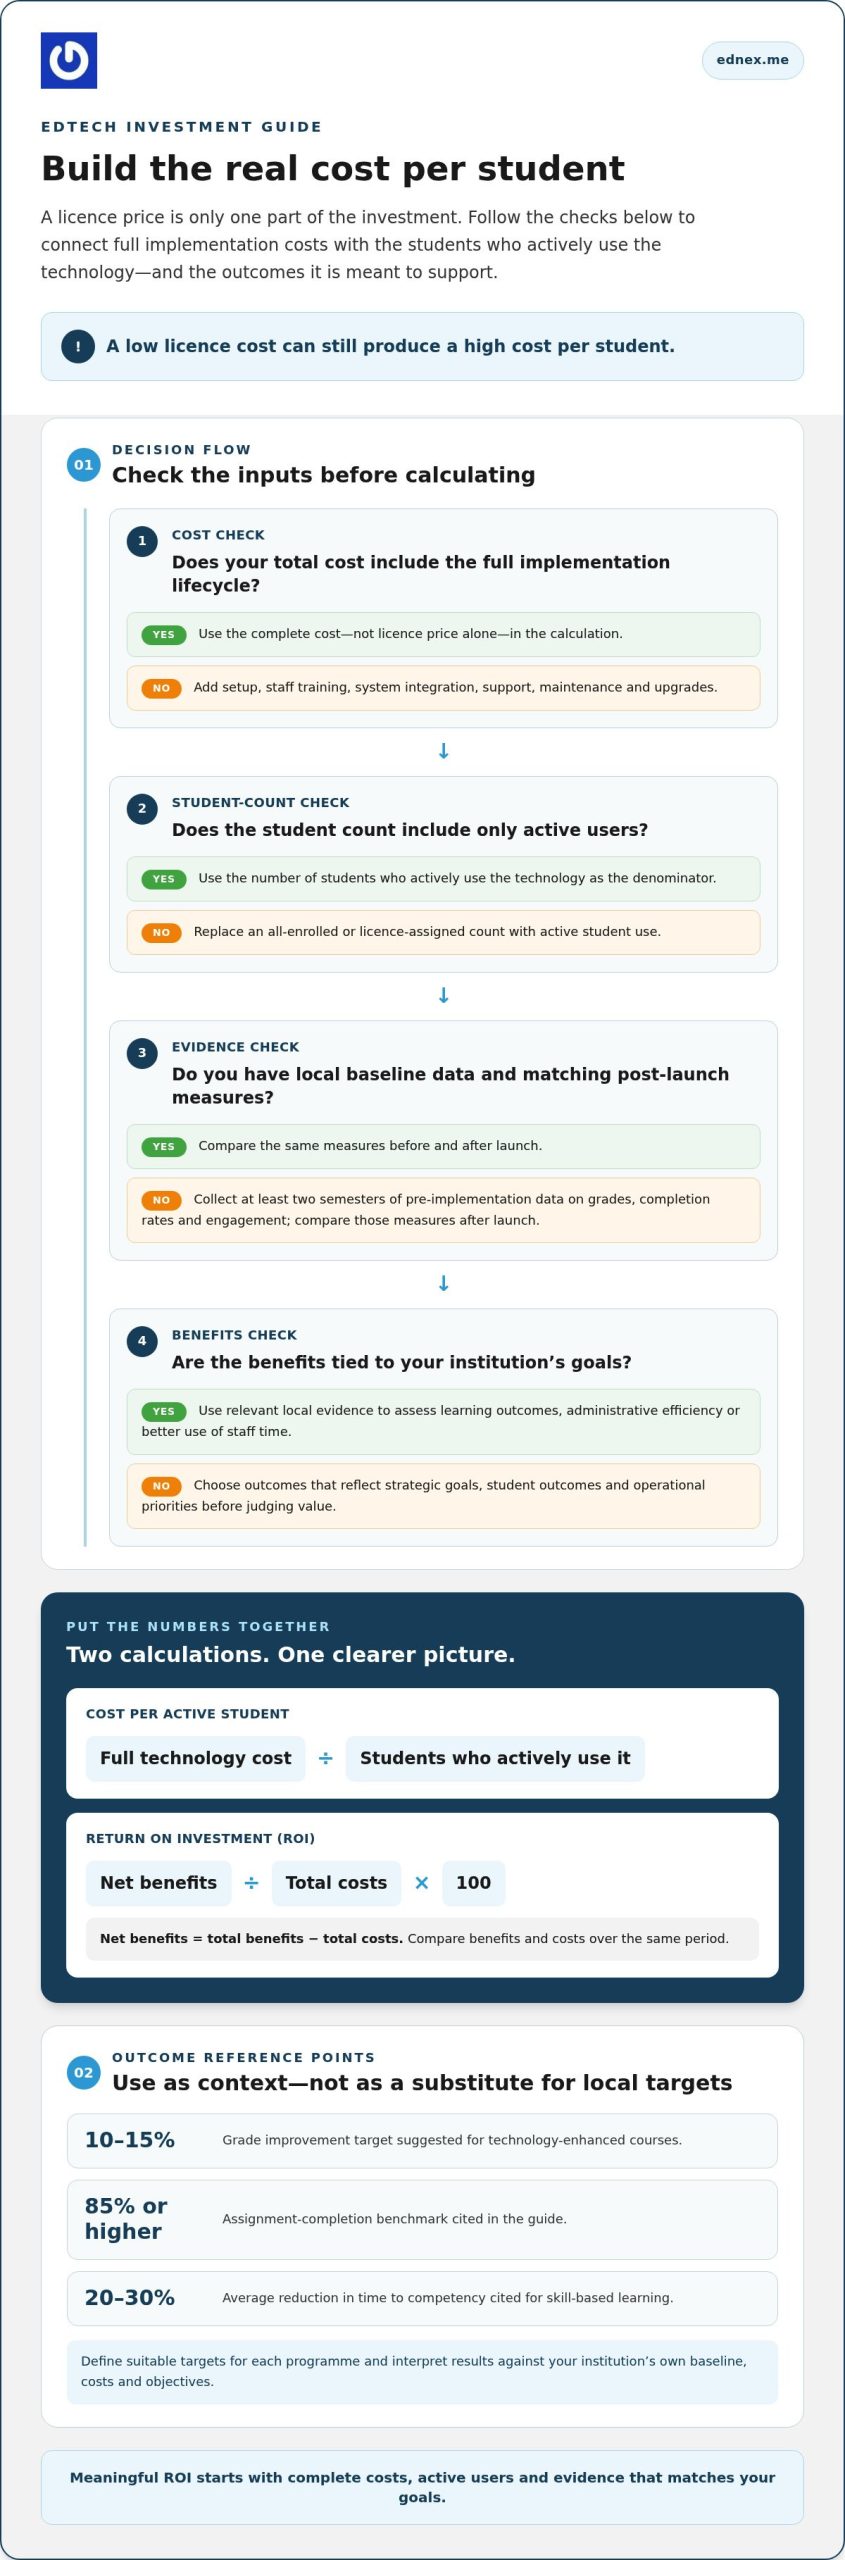
A low licence cost can still produce a high cost per student. When calculating ROI for educational technology, compare net benefits with total costs, then multiply by 100; net benefits are total benefits minus total costs. Divide the full cost across the students who actively use the technology to understand its per-student impact.
That calculation is useful only when it reflects the real work of implementation. Setup, staff training, system integration, support, maintenance and upgrades all contribute to total cost. Benefits may include stronger learning outcomes, more efficient administration or better use of staff time.
This article explains how educational institutions can choose meaningful ROI measures, build a complete cost-per-student picture and assess value over time. You’ll see why licence price alone can mislead, how to include the often-overlooked costs around implementation, and which academic, operational and reputational outcomes can help UAE institutions make more informed technology decisions.
Key Takeaways
- Choose ROI measures that reflect your institution’s strategic goals, then use local performance data to assess progress.
- Connect technology use with learning, operational efficiency and stakeholder experience to build a fuller picture of value.
- Calculate cost per active student and compare it with outcomes, rather than relying on licence price alone.
- Account for the full implementation lifecycle, including training, integration and ongoing support, when evaluating an investment.
How Are Institutions Engaging in ROI Practices?
Institutions should tailor return on investment measures to their strategic goals, student outcomes and operational priorities. Schools and universities can use benchmarks for context, but no single ratio captures value across every institution.
Institutional Data in ROI Calculations
Institutional data means the local academic, engagement and usage records used to evaluate a technology investment. It matters because student needs, course designs and starting performance differ across institutions. Collect at least two semesters of pre-implementation data on grades, completion rates and engagement, then compare results against the same measures after launch.
A data dashboard can bring licence assignments and platform activity together, helping teams right-size subscriptions. A Glimpse K12 survey found that 67 percent of software licences go unused, and reported up to 90 percent in some cases. Compare assigned licences with active use before renewal, then align access with actual student and staff demand.
Dashboards rely on consistent records and clear data access. Establish a baseline for each selected measure, such as course completion or platform participation, and display post-launch results alongside it. Document data sources, permissions and definitions so academic and technology teams interpret measures consistently. This also helps reveal data gaps that could weaken an ROI assessment.
ROI Benchmarks for Education
ROI benchmarks are reference ratios or outcome targets institutions use to compare investments. Guides cite ratios of 2:1 to 4:1 for well-implemented initiatives, while comprehensive measurement frameworks cite 3:1 to 5:1. These figures offer context, not a substitute for an institution’s own baseline, costs and objectives.
Data maturity shapes how confidently teams can compare results. Disconnected systems can make it difficult to link platform usage with learning outcomes, while privacy and compliance processes can affect access to student records. Define data permissions, document each source and report only relevant measures. In higher education, this creates a traceable assessment without treating every available metric as meaningful.
Why is EdTech ROI hard to measure?
Schools can compare tools using consistent outcomes, time periods and total-cost categories. Higher education institutions measure ROI to judge whether technology advances learning or operational priorities and merits continued investment.
For a simple example, saving one hour weekly for 10 teachers across 36 teaching weeks equals 360 staff hours annually. To estimate financial return, value those hours using the institution’s own labour costs, then compare the resulting benefit with total technology costs.
A September 2025 EDUCAUSE QuickPoll of 124 higher education technology leaders found that 71% considered ROI at least moderately important. Yet 54% said their institution did not measure or consider ROI for new tools, or they did not know. This gap makes clear reporting useful for investment decisions.
Attribution and Long-Term Measurement
Attribution means distinguishing technology’s contribution from other changes that influence outcomes. A course redesign, staffing shift or new assessment policy can affect results alongside an EdTech tool. Compare consistent measures over time and record related changes, so decision-makers can interpret trends without attributing every improvement to the technology.
Time savings also need careful measurement. Log marking and preparation activities for two weeks before and two weeks after a tool’s introduction, using the same task definitions and staff groups. That comparison helps reduce errors caused by inconsistent reporting or workload changes.
Technology Use and Student Outcomes
Technology-use measures show whether students and faculty engage with a tool; student outcomes show whether that use connects with meaningful progress. Track online-class attendance, discussion participation, time on tasks and platform activity alongside completion or progression rates.
Compare candidate tools using identical measures, such as course completion, staff time and operational costs. Then compare net benefits with total costs over the same period. A dashboard that separates usage, academic outcomes and operational reporting makes trade-offs visible, while avoiding a single average that hides differences between courses.
Institutions assessing learning activities can explore technology-enabled learning environments as one context for connecting implementation choices with measurable outcomes.
How do you calculate true cost per student?
Calculate per-student cost by dividing technology spending by the number of students who use it, then connect that figure to learning evidence. The denominator matters: counting all enrolled students can overstate adoption if only some actively use the platform.
Compare that cost with the outcomes the investment aims to influence, such as course completion, skill development or student engagement. A low unit cost alone does not establish value.
Leaders can organize evaluation around three connected dimensions: learning, student experience and operational impact. Academic measures might include grades, assignment completion and time to competency. The guide suggests a 10-15% grade improvement target for technology-enhanced courses, while 85% or higher is cited as an assignment-completion benchmark. Treat these as reference points, then define suitable targets for each programme.
Engagement evidence adds context to performance results. Track attendance, task participation, platform activity and student feedback together, then compare patterns across courses or groups. For skill-based learning, the guide cites a 20-30% average reduction in time to competency. Pairing that measure with demonstrated proficiency helps show whether faster progress reflects learning rather than simply shorter activity.
Personalized outreach can also shape the student experience. For example, use participation or completion signals to identify learners who may benefit from timely academic guidance, then evaluate whether engagement changes. Institutions measuring ROI across multiple dimensions report 40% higher satisfaction with technology investments than those relying purely on financial metrics.
Collaboration between academic, administrative and technology teams strengthens the evidence. Agree on the active-user definition, reporting period and outcome measures before comparing investments. Then assess adoption alongside results: strong engagement without improved learning may call for different instructional support, while improved outcomes at a manageable per-student cost can inform future investment decisions.
Including setup, training, integration and support costs
A credible cost assessment includes upfront implementation and ongoing expenses. Record each cost in the period it supports, so the academic return can be compared with the resources required to achieve it.
Setup and Training Costs
Setup and training costs cover configuring technology and preparing users. A licence alone does not capture the effort needed for adoption. Record installation, configuration and staff training separately, then note whether each is a one-time or recurring expense. Include launch-period setup and professional development alongside the licence, rather than treating them as incidental.
Integration Costs
Integration costs are the resources needed to connect a tool with existing systems and workflows. Linked data and processes require implementation work, testing and coordination. Identify which systems exchange information, document staff effort for each connection, and include ongoing maintenance where relevant. This gives a more complete assessment than comparing purchase prices alone.
Build a lifecycle view that includes implementation, maintenance, support and upgrades over the technology’s lifespan. Separate upfront costs from ongoing expenses, then assign each to the relevant academic period. For example, include recurring support expenses in every period they apply to, while assigning initial configuration to the launch period.
Support and feedback also require resources. Track support tasks, staff time and maintenance work alongside direct expenses. If users need continued professional development, include that effort in the relevant period. A cost register shared by academic, finance and technology teams helps prevent duplicate entries and reveal overlooked work.
Finally, calculate total cost per active student for each reporting period by dividing complete costs by active users. Compare the result with intended learning and operational outcomes. Keep the denominator consistent, or changes in reported usage can distort the apparent cost trend.
For institutions planning a technical learning environment, explore educational technology solutions as part of implementation planning.
Ednex: STEAM Programs
Ednex LLC offers STEAM Programs and practical learning options for institutions developing technology-rich education. When ROI analysis points to stronger hands-on learning, Robotics and Coding for schools or Arduino Education can connect technology choices with classroom activities and student skill development.
For schools planning a dedicated learning environment, a Future Science Lab Setup can be a focused next step. Consider these offerings when defining intended outcomes, expected student participation and implementation resources. Those priorities give institutional leaders a clearer basis for evaluating fit and tracking value over time.
To discuss your educational technology needs, contact Ednex LLC or visit ednex.me.
Turn ROI Insight Into Your Next Learning Initiative
Calculating ROI for educational technology is most valuable when it informs what an institution builds next. Use the evaluation to identify where learners need deeper practice, where educators need stronger instructional tools, and which capabilities merit sustained investment. Then turn those priorities into a focused initiative with clear intended outcomes and a practical way to assess progress.
Ednex LLC offers STEAM Programs, Robotics and Coding for schools, and Arduino Education to support institutions developing hands-on learning experiences. These options can connect technology decisions with purposeful activities, student skills and the learning environment your institution aims to create. Start with a conversation grounded in your educational priorities and implementation goals.
Contact Ednex LLC to discuss your needs and explore a considered path toward your next learning initiative. Progress begins with a clear purpose and the confidence to act on it.
Frequently Asked Questions
How do districts use Return on Instruction to demonstrate good stewardship of K-12 education funding initiatives?
Districts demonstrate responsible stewardship by connecting spending to instructional priorities and documenting evidence of progress. For example, a district funding classroom technology can report how the initiative supports teaching goals, which measures it tracks, and how findings inform renewal or reallocation decisions. A clear record helps school leaders explain what was purchased and how the investment supports learning and responsible use of public funds.
How do you measure learning impact?
Measure learning impact by selecting an outcome that matches the intervention, then reviewing comparable student work over time. For example, assess a literacy tool through rubric-scored writing or a technical course through demonstrated task proficiency. Keep assessment criteria stable across cohorts, and record changes in teaching practice that could also influence results. This gives leaders evidence to interpret progress without attributing every change to technology.
How do you value teacher time saved?
Estimate the value of time saved by multiplying verified hours recovered by the institution’s relevant hourly employment cost. Use matched activity logs or workload records, and distinguish time genuinely freed from tasks merely shifted elsewhere. For example, if automated reporting reduces manual data entry, check whether staff use that time for instruction, student support or other work. Treat released capacity as an operational benefit, not a cash saving unless budgets change.
How do you calculate ROI for educational technology?
Calculate ROI by dividing net benefits by total costs, then multiplying by 100. First subtract total costs from the benefits attributed to the technology to find net benefits. For a fair comparison, use the same evaluation period and include only benefits supported by institutional evidence. Report the underlying measures as well as the percentage, so decision-makers can understand what drove the result and compare investments consistently.
What costs should be included when calculating edtech ROI?
Include direct payments and the internal resources required to make the technology usable. Consider licence or purchase expenses, configuration, staff training, integration work, maintenance, support and upgrades. Also record staff effort spent on procurement, administration or adapting academic activities. Separate one-time implementation items from recurring commitments, then allocate shared costs consistently across the programmes or users that benefit.
How can schools measure the benefits and outcomes of educational technology?
Schools can assess benefits across academic, operational and institutional outcomes. Alongside learning evidence, they might examine student and parent satisfaction, graduate placement, research activity, awards or reporting effort. Choose measures that match the initiative’s purpose and assign responsibility for each data source. Reviewing these indicators together helps leaders see whether value extends beyond classroom performance and supports broader institutional priorities.
Related Posts ...




Comments are disabled