
Top 5 Experiments Every Engineering Student Should Try with a Wind Tunnel
Whether you’re starting your first aerodynamics course or leading a lab, wind tunnel experiments for engineering students are a powerful way to turn theory into intuition. From lift and drag fundamentals to boundary-layer behavior and real-world design trade-offs, the right lab sequence builds skills students actually use in aerospace, automotive, civil, and renewable engineering.
At EdNex, we help universities across the MENA region set up an educational wind tunnel that is robust, student-friendly, and aligned to course outcomes complete with experiments, training, and ongoing support.
Why wind tunnels still matter (even in the CFD era)
Computational tools are essential, but physical testing teaches what simulations can’t: how real air behaves around imperfect surfaces and fixtures; how instruments drift; how small setup changes create big result swings. Students also learn experimental discipline calibration, run sheets, uncertainty estimates, and how to present reproducible results. The result is an engineer who can both model and measure.
Meet the educational wind tunnel
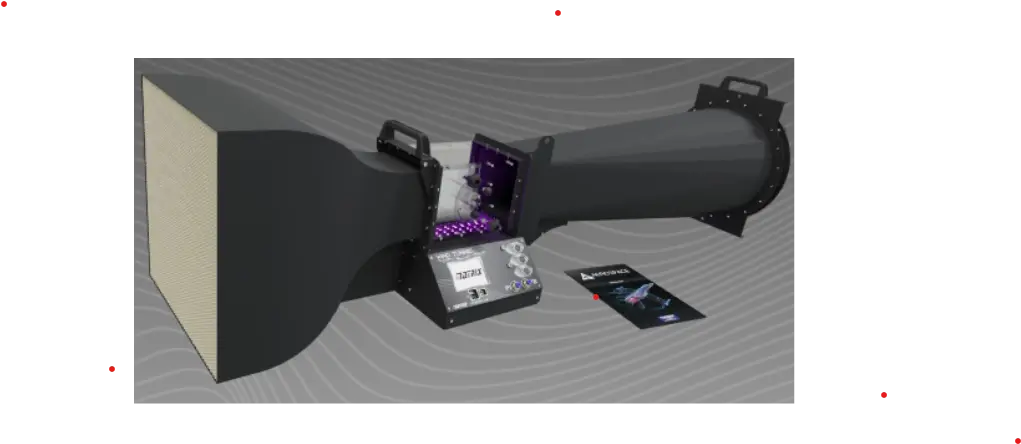
A modern educational wind tunnel gives students a clear test section for observation, a controllable fan for stable free-stream speeds, and a data acquisition system for real-time logging. Typical accessories include:
- Interchangeable aerofoils for lift/drag studies
- Pitot-static probe for velocity and boundary-layer traverses
- Pressure-tapped models (cylinder/airfoil) for Cp mapping
- A compact force balance (lift/drag) with angle-of-attack control
- Smoke or LED flow visualization for separation and vortex studies
What this means in practice: students can run five high-impact labs in one semester without wrestling the hardware into submission.
Before you begin: safety, calibration & good habits
- Airflow & smoke: Ensure safe operation of smoke/neutral fog; purge the test section between runs.
- Zero checks: Tare the force balance, confirm pitot-static zero, and verify pressure channels.
- Run sheet: Always record test conditions date/time, temperature, tunnel speed, model, angle of attack (AoA), and instrumentation used.
- Uncertainty: Note balance resolution, repeat each run, and capture a baseline/control.
The Top 5 Experiments
1) Aerofoil lift and drag experiment (complete polar & stall)
Goal: Build the CL-α, CD-α and CL/CD polar; identify stall onset and optimum AoA.
Why it matters: This is the canonical aerofoil lift and drag experiment students finally connect Bernoulli/Euler theory to data they collected themselves.
Equipment: Aerofoil model on a two-component balance with AoA control; DAQ; tunnel speed control.
Procedure snapshot:
- Pick a reference speed and sweep AoA from negative to post-stall.
- Log lift/drag at each step; compute coefficients using dynamic pressure and planform area.
- Repeat at a second speed to show Reynolds-number effects.
What to submit: CL-α slope, stall angle, CDmin, and a short discussion of wall/blockage and mounting effects.
Extension: Compare two aerofoils (e.g., cambered vs symmetric) and explain mission-driven design trade-offs (UAV vs trainer wing).
2) Pressure distribution mapping (Cp) on cylinder & airfoil
Goal: Measure Cp around a cylinder (Cp(θ)) and along an airfoil (Cp(x)) to see acceleration, adverse gradients, and separation.
Why it matters: Pressure taps reveal the invisible students can integrate Cp to estimate lift/drag and compare with force-balance readings.
Equipment: Pressure-tapped cylinder and airfoil; pitot-static for reference; DAQ or manometer bank.
Procedure snapshot:
- At fixed tunnel speed, record Cp at all taps for several AoA values.
- Plot Cp versus θ (cylinder) and x/c (airfoil).
- Integrate to estimate forces; compare to measured lift/drag.
What to submit: Cp curves with clearly labeled suction peaks, estimated separation point, and comments on viscous vs inviscid expectations.
Extension: Add a simple trip (tape/roughness) and document how Cp and stall change.
3) Drag coefficients of bluff vs streamlined shapes
Goal: Rank CD of common shapes (sphere, cube, teardrop, flat plate, etc.) and relate geometry to wake size and separation.
Why it matters: Students discover how shaping not just size drives drag and energy losses; perfect for automotive and civil wind loads.
Equipment: Interchangeable drag models; force balance; flow visualization.
Procedure snapshot:
- Test each shape at several speeds; record drag force and compute CD.
- Capture images/video of smoke visualization to show separation and wakes.
What to submit: A bar chart of CD by shape, annotated stills of the flow, and a one-paragraph “design memo” explaining a low-drag pick.
Extension: Prototype a small fillet or fairing in foam/3D print; show a ≥10–15% CD reduction to earn bonus points.
4) Boundary-layer profile using a pitot-static traverse
Goal: Measure near-wall velocity profiles and estimate boundary-layer thickness (δ), displacement thickness (δ*) and shape factor (H).
Why it matters: Many students learn the equations but never see how the profile actually looks or how δ scales with Re.
Equipment: Pitot-static probe on a micrometer traverse; DAQ; smooth flat plate or tunnel wall reference.
Procedure snapshot:
- At two or three free-stream speeds, traverse from wall to free stream in small steps.
- Convert pressure to velocity; normalize by U∞ and plot u/U∞ vs y.
- Fit laminar/turbulent profiles and compute δ, δ*, θ and H.
What to submit: Profile plots with calculated thicknesses and a table comparing theory vs experiment.
Extension: Add a roughness strip or trip and repeat to see turbulent onset.
5) Flow-visualization design sprint (student-made test pieces)
Goal: Use smoke/LED flow to iterate a student-designed part reduce drag or delay separation in 2–3 design cycles.
Why it matters: It’s the bridge from lab to product. Students practice hypothesis-test-iterate under time pressure and quantify improvement.
Equipment: 3D-printed or foam models mounted on the balance; smoke/LED; camera for stills/short clips.
Procedure snapshot:
- Capture baseline flow and forces for the initial design.
- Modify one design parameter at a time (nose radius, tail taper, camber, fillet).
- Record new flow visuals and forces; keep a design log.
What to submit: Side-by-side images/GIFs, a ΔCD (%) or ΔCL/CD metric, and a 150-word rationale for the final design.
Extension: Share STLs and a one-page design note to a class repository.
How EdNex adds value for universities across MENA
- Design & procurement: We help you select the right educational wind tunnel, models, and sensors to match course outcomes and local lab spaces.
- Turnkey installation: Delivery, commissioning, and verification so Week-1 labs run smoothly.
- Faculty enablement: Train-the-trainer workshops, TA guides, and grading rubrics to streamline assessment.
- Curriculum alignment: We map each experiment to program outcomes (e.g., measurement, data analysis, teamwork, ethics) and help you build lab manuals that pass internal and external reviews.
- Spares & support: Local response across UAE, KSA, Qatar, Oman, and Bahrain; we keep you test-ready all semester.
- Capstone pathways: We co-design mini-projects and industry showcases students present measurable performance gains, not just pretty smoke pictures.
Ready to modernize your fluids/aerodynamics lab?
Book a live demo with EdNex and explore.



No comment